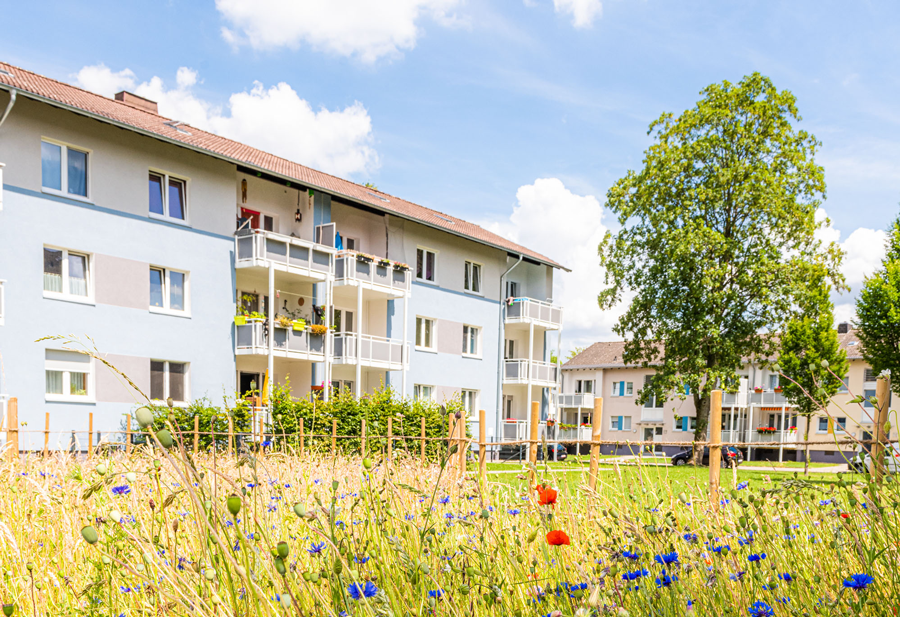
Development and New Construction
Completion of new construction
Development and New Construction – Completion of new construction
|
2021 by region |
||||||||||||||
|
Key Figures |
Unit |
2021 |
Germany |
Austria |
Sweden |
|||||||||
|
General Project Data |
||||||||||||||
|
Rented units 1) |
number |
2,201 |
1,751 |
275 |
175 |
|||||||||
|
Rentable area |
m² |
153,651 |
130,752 |
14,294 |
8,605 |
|||||||||
|
of which residential area |
% |
98.8 |
98.7 |
100.0 |
98.6 |
|||||||||
|
of which commercial area |
% |
0.5 |
0.5 |
0.0 |
1.4 |
|||||||||
|
of which social institutions 2) |
% |
0.7 |
0.8 |
0.0 |
0.0 |
|||||||||
|
Site area |
m² |
119,995 |
101,022 |
10,771 |
8,202 |
|||||||||
|
of which green spaces |
% |
29.7 |
27.8 |
30.1 |
52.5 |
|||||||||
|
Energy and Heat Supply |
||||||||||||||
|
Rentable area not including vertical expansion |
m² |
134,669 |
115,141 |
14,294 |
5,235 |
|||||||||
|
of which district heating 3) |
% |
50.7 |
50.1 |
37.8 |
100.0 |
|||||||||
|
of which renewable energy sources/ hybrid systems 4) |
% |
19.5 |
15.0 |
62.2 |
0.0 |
|||||||||
|
of which fossil energy sources 5) |
% |
29.8 |
34.9 |
0.0 |
0.0 |
|||||||||
|
of which primary energy requirement of ≤30 kWh/m²a |
% |
35.9 |
37.3 |
37.8 |
0.0 |
|||||||||
|
of which primary energy requirement of >30 and ≤50 kWh/m²a |
% |
45.5 |
53.3 |
0.0 |
0.0 |
|||||||||
|
of which primary energy requirement of >50 and ≤75 kWh/m²a |
% |
9.9 |
9.4 |
0.0 |
48.0 |
|||||||||
|
of which primary energy requirement of >75 kWh/m²a |
% |
8.6 |
0.0 |
62.2 |
52.0 |
|||||||||
|
Average primary energy requirement 6) |
kWh/m²a |
38.6 |
33.7 |
62.6 |
79.8 |
|||||||||
|
Installed output of photovoltaic systems |
kWp |
255 |
255 |
0 |
0 |
|||||||||
|
Mobility 7) |
||||||||||||||
|
Proportion of projects featuring charging stations 8) |
% |
29.6 |
26.1 |
50.0 |
50.0 |
|||||||||
|
Proportion of projects featuring empty cable conduits for charging stations |
% |
25.9 |
26.1 |
0.0 |
50.0 |
|||||||||
|
Number of bicycle parking spaces per rented unit |
Avg. |
1.7 |
1.7 |
1.4 |
1.6 |
|||||||||
|
Number of vehicle parking spaces per rented unit |
Avg. |
0.6 |
0.6 |
0.7 |
0.3 |
|||||||||
|
Minutes to reach the nearest public transport connection on foot |
Avg. |
3.9 |
3.5 |
6.1 |
3.4 |
|||||||||
- 1) Both projects to hold and to sell included. Including commercial, therefore not identical with the residential units reported in the Annual Report (2,200 units). Relative figures refer to rental space.
- 2) Category includes kindergartens, schools, homes and similar institutions.
- 3) Separate presentation, as both renewable and fossil energy sources can be used in district heating supply.
- 4) At least proportionate supply from renewable energy sources: biogas, biomass, wood pellets and heat pump (additional condition: Heat pump must be partly supplied with RE (solar thermal, geothermal, PV, or similar)).
- 5) Fossil energy sources: natural gas, crude oil, non-renewably generated electricity.
- 6) Based on completed rental space without extensions and without purely commercial buildings (analogous to Sustainability Performance Index indicator).
- 7) Calculated exclusively on the basis of completed projects without taking into account vertical expansion.
- 8) Charging stations can be publicly accessible or assigned to a private parking space.
New construction project pipeline
Development and New Construction – New construction project pipeline
|
2021 by region |
||||||||||||||
|
Key Figures |
Unit |
2021 |
Germany |
Austria |
Sweden |
|||||||||
|
Project Pipeline New Buildings 1) |
||||||||||||||
|
Rented units |
number |
12,737 |
9,407 |
2,934 |
396 |
|||||||||
|
Rentable area |
m² |
928,890 |
700,055 |
208,385 |
20,450 |
|||||||||
|
of which residential area |
% |
92.8 |
92.0 |
94.6 |
99.6 |
|||||||||
|
of which commercial area |
% |
4.5 |
4.4 |
4.9 |
0.4 |
|||||||||
|
of which social institutions 2) |
% |
2.8 |
3.5 |
0.4 |
0.0 |
|||||||||
|
of which completion in 2022 |
% |
26.6 |
12.6 |
74.6 |
18.0 |
|||||||||
|
of which completion in 2023 |
% |
20.5 |
22.7 |
10.5 |
49.4 |
|||||||||
|
of which completion in 2024 |
% |
27.9 |
36.0 |
0.0 |
32.6 |
|||||||||
|
of which completion after 2024 |
% |
25.0 |
28.8 |
14.9 |
0.0 |
|||||||||
- 1) Projects under construction and projects with planned construction start in 2022. Both projects to hold and to sell taken into account. Relative key figures refer to rental space.
- 2) Kindergartens, schools, homes and comparable institutions.


