

New Construction and Conversions
Completion of New Construction
Completion of New Construction
2024 by Country | |||||||||||||||||
Key Figures | Unit | 2022 | 2023 | 2024 | Germany | Austria | Sweden | ||||||||||
General Project Data | |||||||||||||||||
Rented units | number | 3,776 | 2,460 | 3,747 | 3,735 | 0 | 12 | ||||||||||
Rentable area | m² | 266,504 | 166,284 | 277,588 | 276,885 | 0 | 703 | ||||||||||
of which residential area | % | 96.4 | 94.6 | 90.1 | 90.1 | 0.0 | 100.0 | ||||||||||
of which commercial area | % | 2.8 | 3.4 | 9.9 | 9.9 | 0.0 | 0.0 | ||||||||||
of which social institutions 1) | % | 0.9 | 1.9 | 0.0 | 0.0 | 0.0 | 0.0 | ||||||||||
Site area | m² | 166,379 | 117,812 | 252,359 | 252,359 | 0 | 0 | ||||||||||
of which green spaces | % | 21.6 | 36.8 | 13.2 | 13.2 | 0.0 | 0.0 | ||||||||||
Expenses: new construction | in € million | 607.1 | 291.2 | 224.5 | 208.0 | 16.3 | 0.3 | ||||||||||
Energy and Heat Supply | |||||||||||||||||
Rentable area not including vertical expansion | m² | 240,998 | 154,646 | 271,503 | 271,503 | 0 | 0 | ||||||||||
of which district heating 2) | % | 59.6 | 71.5 | 91.4 | 91.4 | 0.0 | 0.0 | ||||||||||
of which renewable energy sources/hybrid systems 3) | % | 14.6 | 21.1 | 8.6 | 8.6 | 0.0 | 0.0 | ||||||||||
of which fossil energy sources 4) | % | 25.7 | 7.4 | 0.0 | 0.0 | 0.0 | 0.0 | ||||||||||
of which primary energy requirement of ≤30 kWh/m²a | % | 41.8 | 61.4 | 93.9 | 93.9 | 0.0 | 0.0 | ||||||||||
of which primary energy requirement of >30 and ≤50 kWh/m²a | % | 38.6 | 31.4 | 5.0 | 5.0 | 0.0 | 0.0 | ||||||||||
of which primary energy requirement of >50 and ≤75 kWh/m²a | % | 12.2 | 5.8 | 0.0 | 0.0 | 0.0 | 0.0 | ||||||||||
of which primary energy requirement of >75 kWh/m²a 5) | % | 7.4 | 1.4 | 1.2 | 1.2 | 0.0 | 0.0 | ||||||||||
Average primary energy requirement 6) | kWh/m²a | 37.7 | 25.3 | 22.0 | 22.0 | 0.0 | 0.0 | ||||||||||
Share with building certification 7) | % | 38.3 | 16.0 | 29.7 | 29.7 | 0.0 | 0.0 | ||||||||||
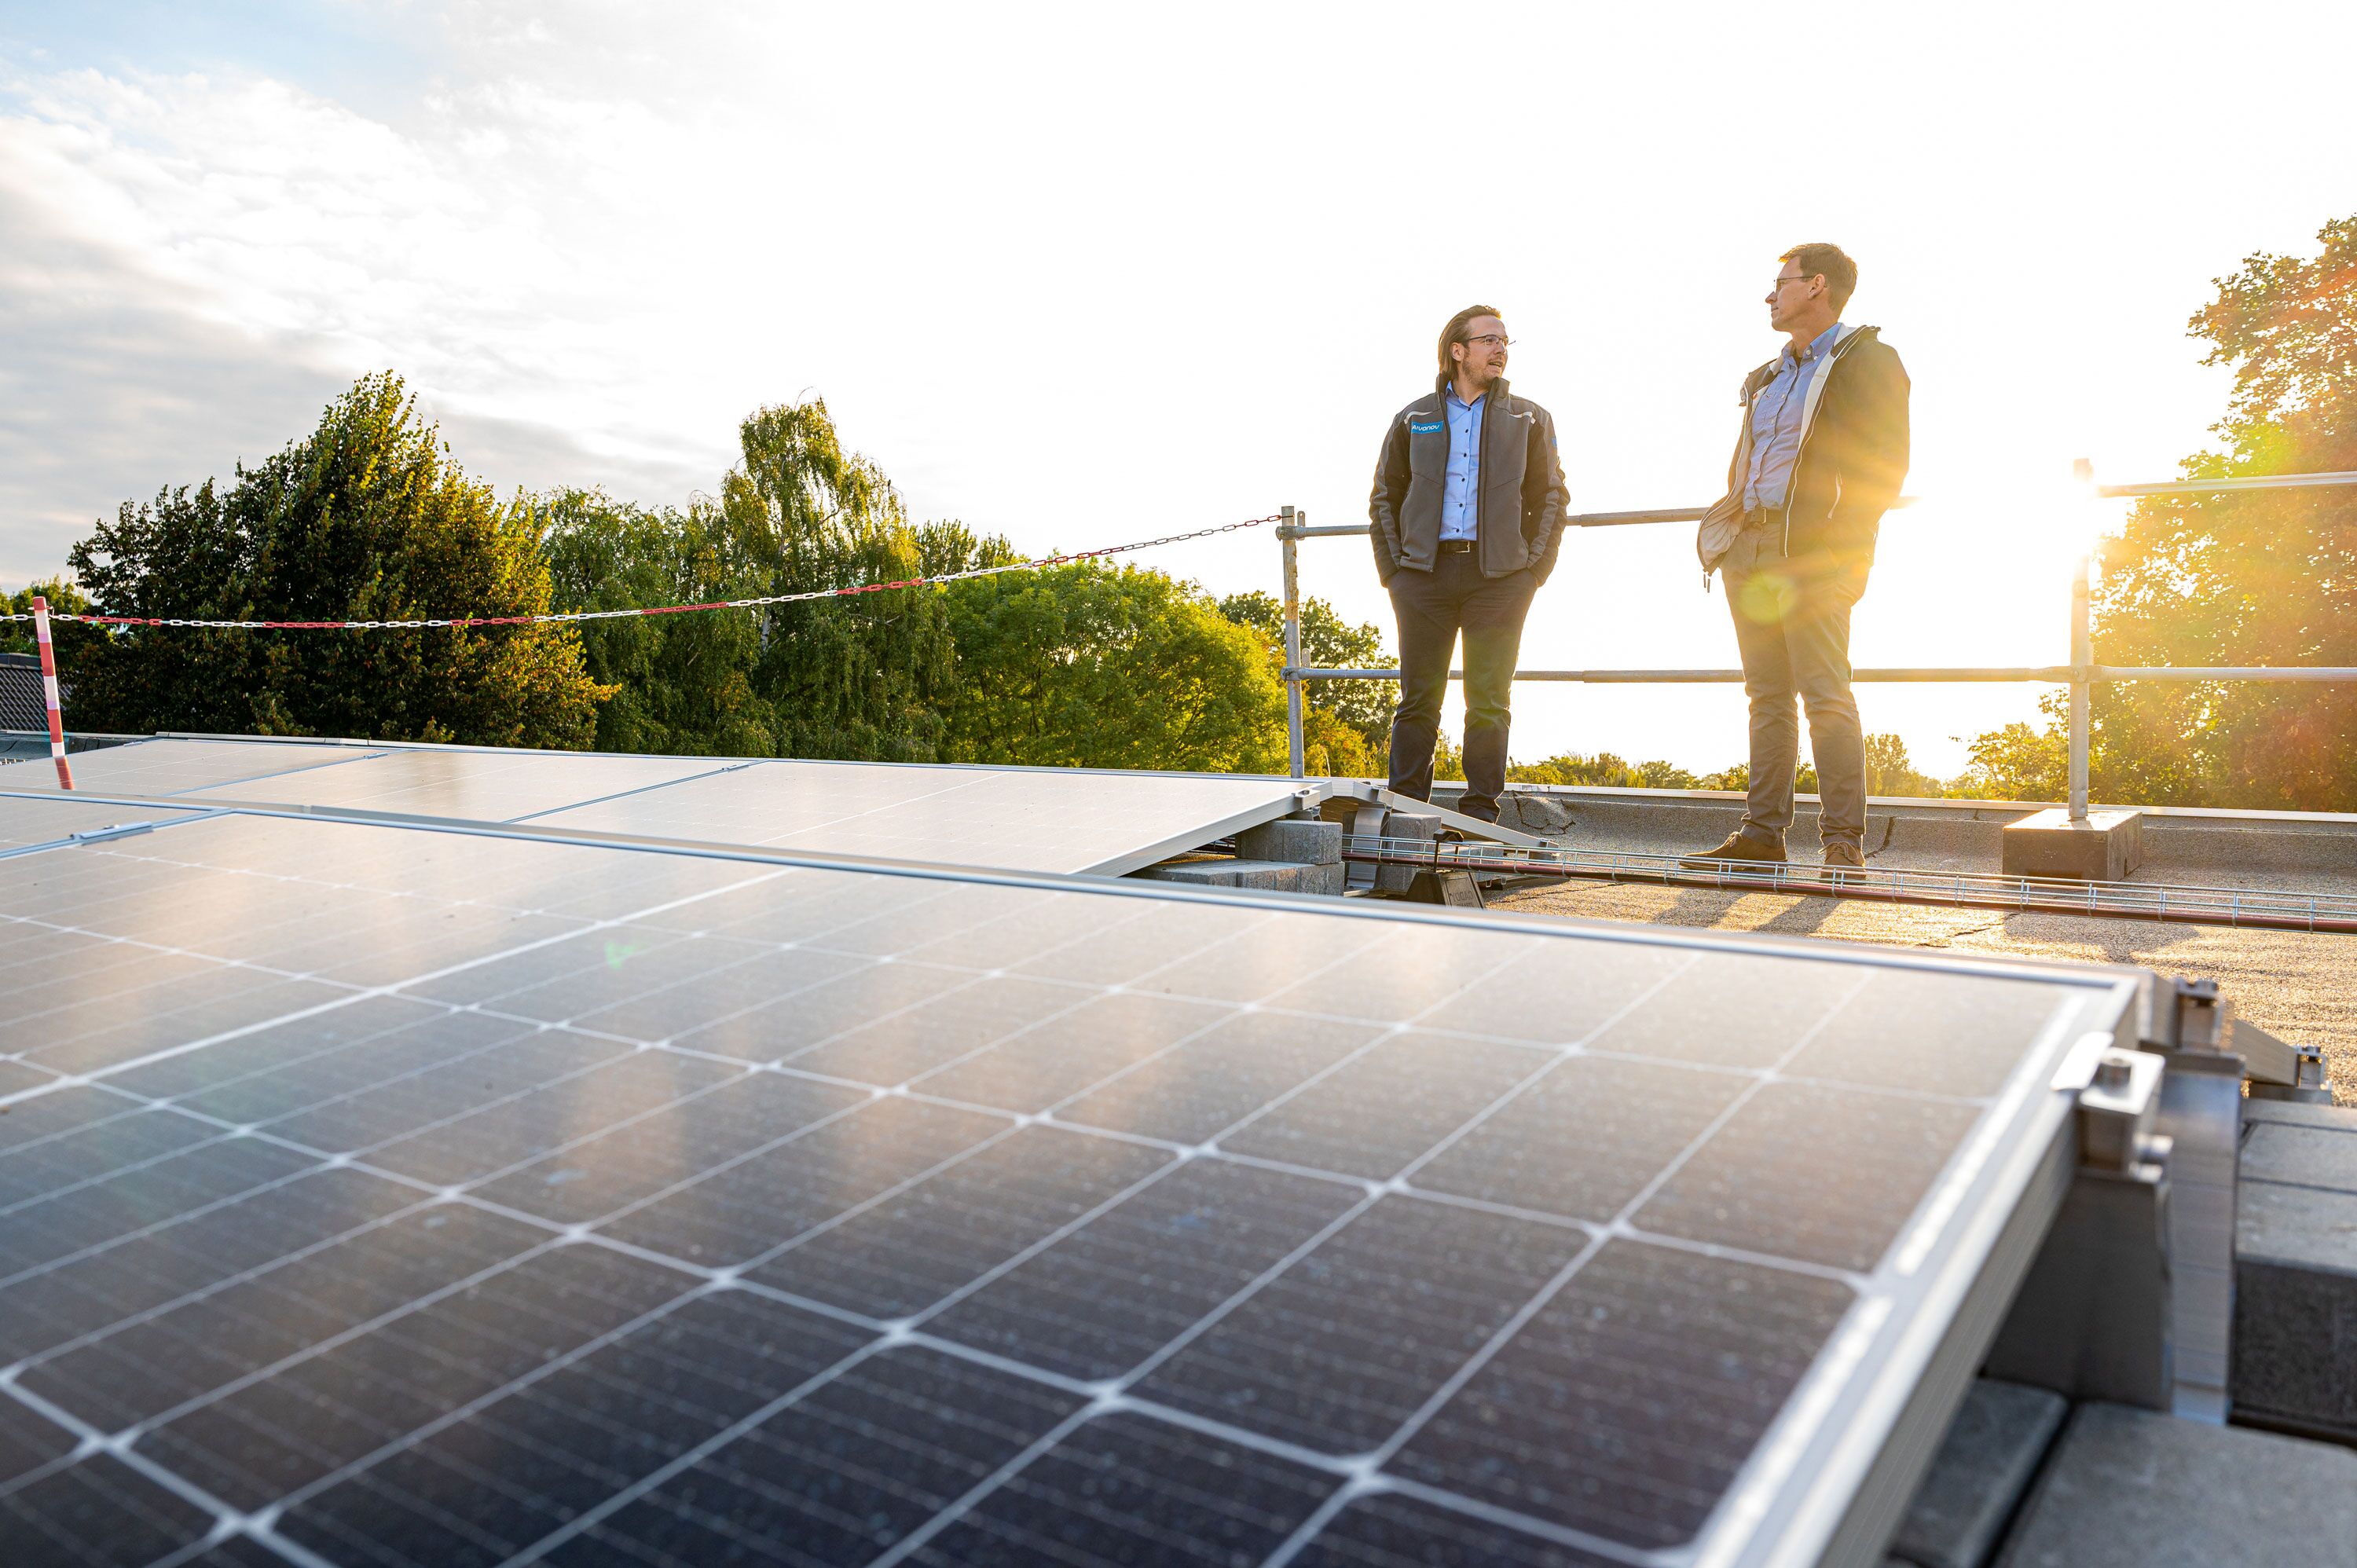
Installed output of photovoltaic systems | kWp | 825 | 360.6 | 190 | 190 | 0 | 0 | ||||||||||
Mobility 8) | |||||||||||||||||
Proportion of projects featuring charging stations 9) | % | 38.6 | 30.0 | 32.4 | 32.4 | 0.0 | 0.0 | ||||||||||
Proportion of projects featuring empty cable conduits for charging stations | % | 63.6 | 28.3 | 41.2 | 41.2 | 0.0 | 0.0 | ||||||||||
Number of bicycle parking spaces per rented unit | Avg. | 2.1 | 1.5 | 0.8 | 0.8 | 0.0 | 0.0 | ||||||||||
Number of vehicle parking spaces per rented unit | Avg. | 0.8 | 0.7 | 0.7 | 0.7 | 0.0 | 0.0 | ||||||||||
Minutes to reach the nearest public transport connection on foot | Avg. | 4.2 | 3.5 | 2.9 | 2.9 | 0.0 | 0.0 | ||||||||||
- 1)Category includes kindergartens, schools, homes and similar facilities.
- 2)Separate presentation, as both renewable and fossil energy sources can be used in district heating supply.
- 3)At least proportionate supply from renewable energy sources: biogas, biomass, wood pellets and heat pumps.
- 4)Fossil energy sources: natural gas.
- 5)New construction projects in Germany relate exclusively to commercial and social facilities.
- 6)Based on completed living space without extensions and without purely commercial buildings (analogous to Sustainability Performance Index).
- 7)DGNB Silver to Platinum for Germany, ÖGNI Bronze to Platinum or KlimaAktiv-Pakt Bronze to Gold in Austria.
- 8)Calculated exclusively on the basis of completed projects without taking into account vertical expansion.
- 9)Charging stations can be publicly accessible or assigned to a private parking space.
Refurbishment
2024 by Country | ||||||||||||||||||
Key Figures | Unit | 2022 | 2023 | 2024 | Germany | Austria | Sweden | |||||||||||
Refurbishment | ||||||||||||||||||
Modernized buildings | number | 818 | 818 | 672 | 643 | 24 | 5 | 2) | ||||||||||
Modernized rented units | number | 7,088 | 7,759 | 6,886 | 6,426 | 171 | 289 | 2) | ||||||||||
avoided emissions due to modernization 1) | t CO₂e | 6,868 | 4,586 | 5,545 | 5,399 | 105 | 41 | 2) | ||||||||||
Modernized rentable area | million m² | 0.43 | 0.48 | 0.42 | 0.38 | 0.01 | 0.02 | 2) | ||||||||||
Rented units with upgraded heating systems | number | 3,376 | 934 | 540 | 113 | 287 | 140 | 2) | ||||||||||
avoided emissions due to upgraded heating systems 1) | t CO₂e | 1,943 | 697 | 624 | 144 | 443 | 37 | 2) | ||||||||||
Refurbishment rate | % | 1.7 | 1.4 | 1.3 | 1.3 | 0.8 | 0.7 | 2) | ||||||||||
Investment in the portfolio 2) | in € million | 1,693.6 | 1,235.8 | 1,376.5 | 1,191.0 | 59.6 | 126.0 | |||||||||||
Investment intensity | €/m²/a | 49.1 | 34.7 | 40.4 | 40.1 | 38.6 | 44.6 | |||||||||||
of which expenses for maintenance | in € million | 856.2 | 722.5 | 764.8 | 635.5 | 54.9 | 74.4 | |||||||||||
Maintenance intensity | €/m²/a | 24.8 | 21.0 | 22.5 | 21.4 | 35.6 | 26.3 | |||||||||||
of which expenses for modernization | in € million | 837.4 | 513.3 | 611.8 | 555.5 | 4.7 | 51.6 | |||||||||||
Modernization intensity | €/m²/a | 24.3 | 13.7 | 18.0 | 18.7 | 3.1 | 18.2 | |||||||||||
- 1)2022 excl. Austria and Sweden.
- 2)As in the previous years, refurbishments and modernizations with a total investment sum of more than € 500 per square meter of rental space per business unit were taken into account for the Sweden region.